Documentation
Everything you need to run a Trace pentest
Learn how a whitebox penetration test works, connect the systems your team already uses, and work with verified findings from the dashboard or the terminal.
Start here
How Trace works
What a whitebox pentest is, what you get back, and what to expect from onboarding.
 Getting startedHow Trace works and what to expect during onboarding.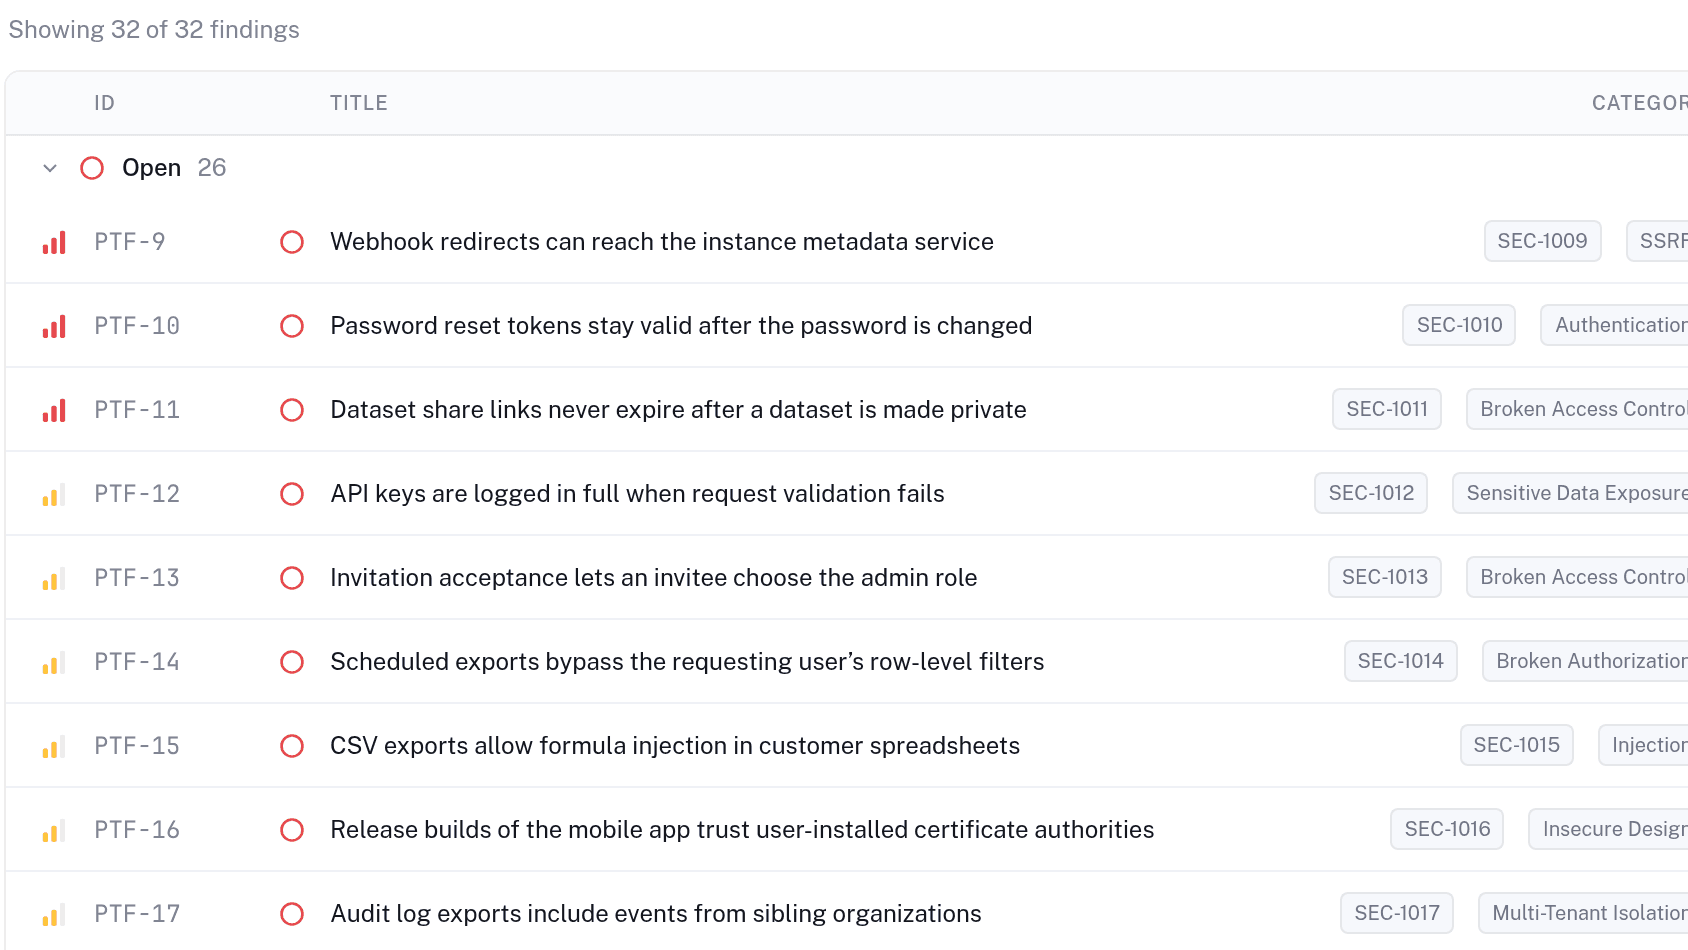
 Pentest overviewHow a Trace penetration test works: what it covers, whitebox through blackbox, and findings verified with proof of exploitation.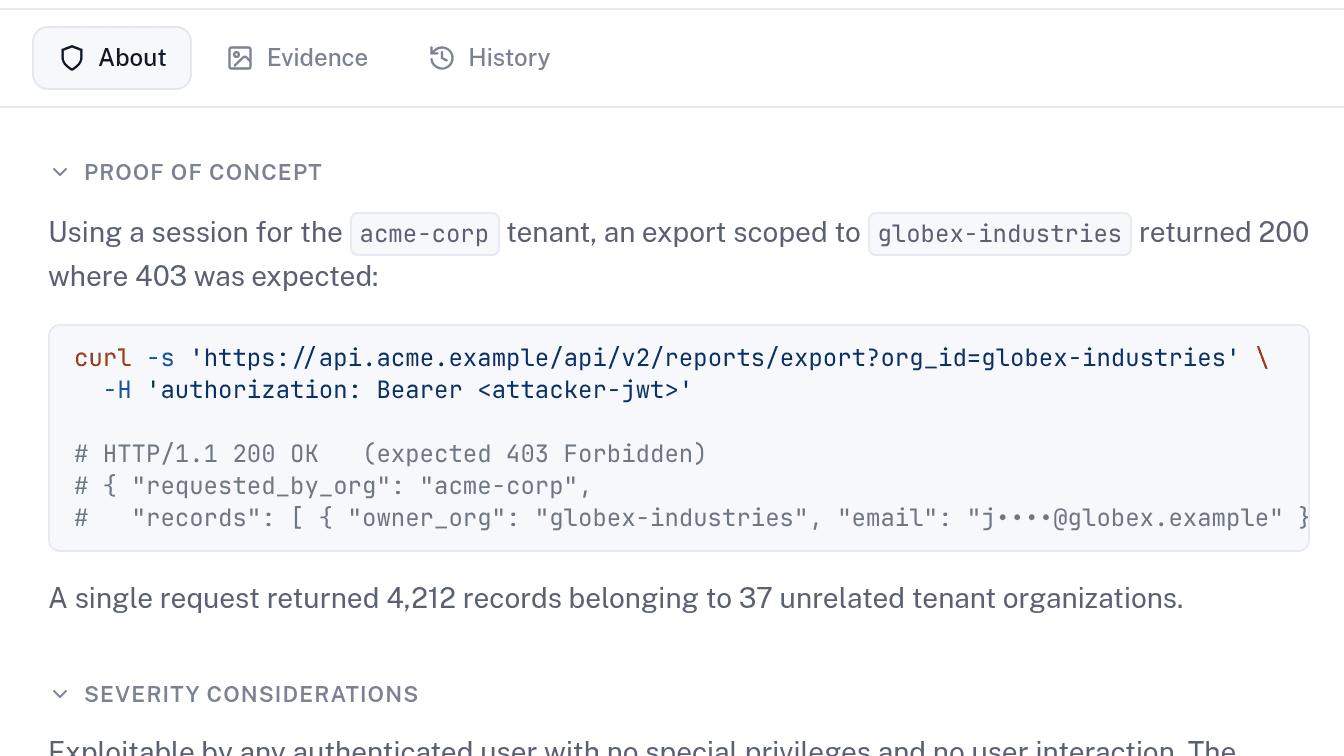
 Verified findingsHow Trace validates pentest findings against your live stack, proving exploitation instead of inferring it, to dramatically cut false positives.
Integrations
Connect your stack
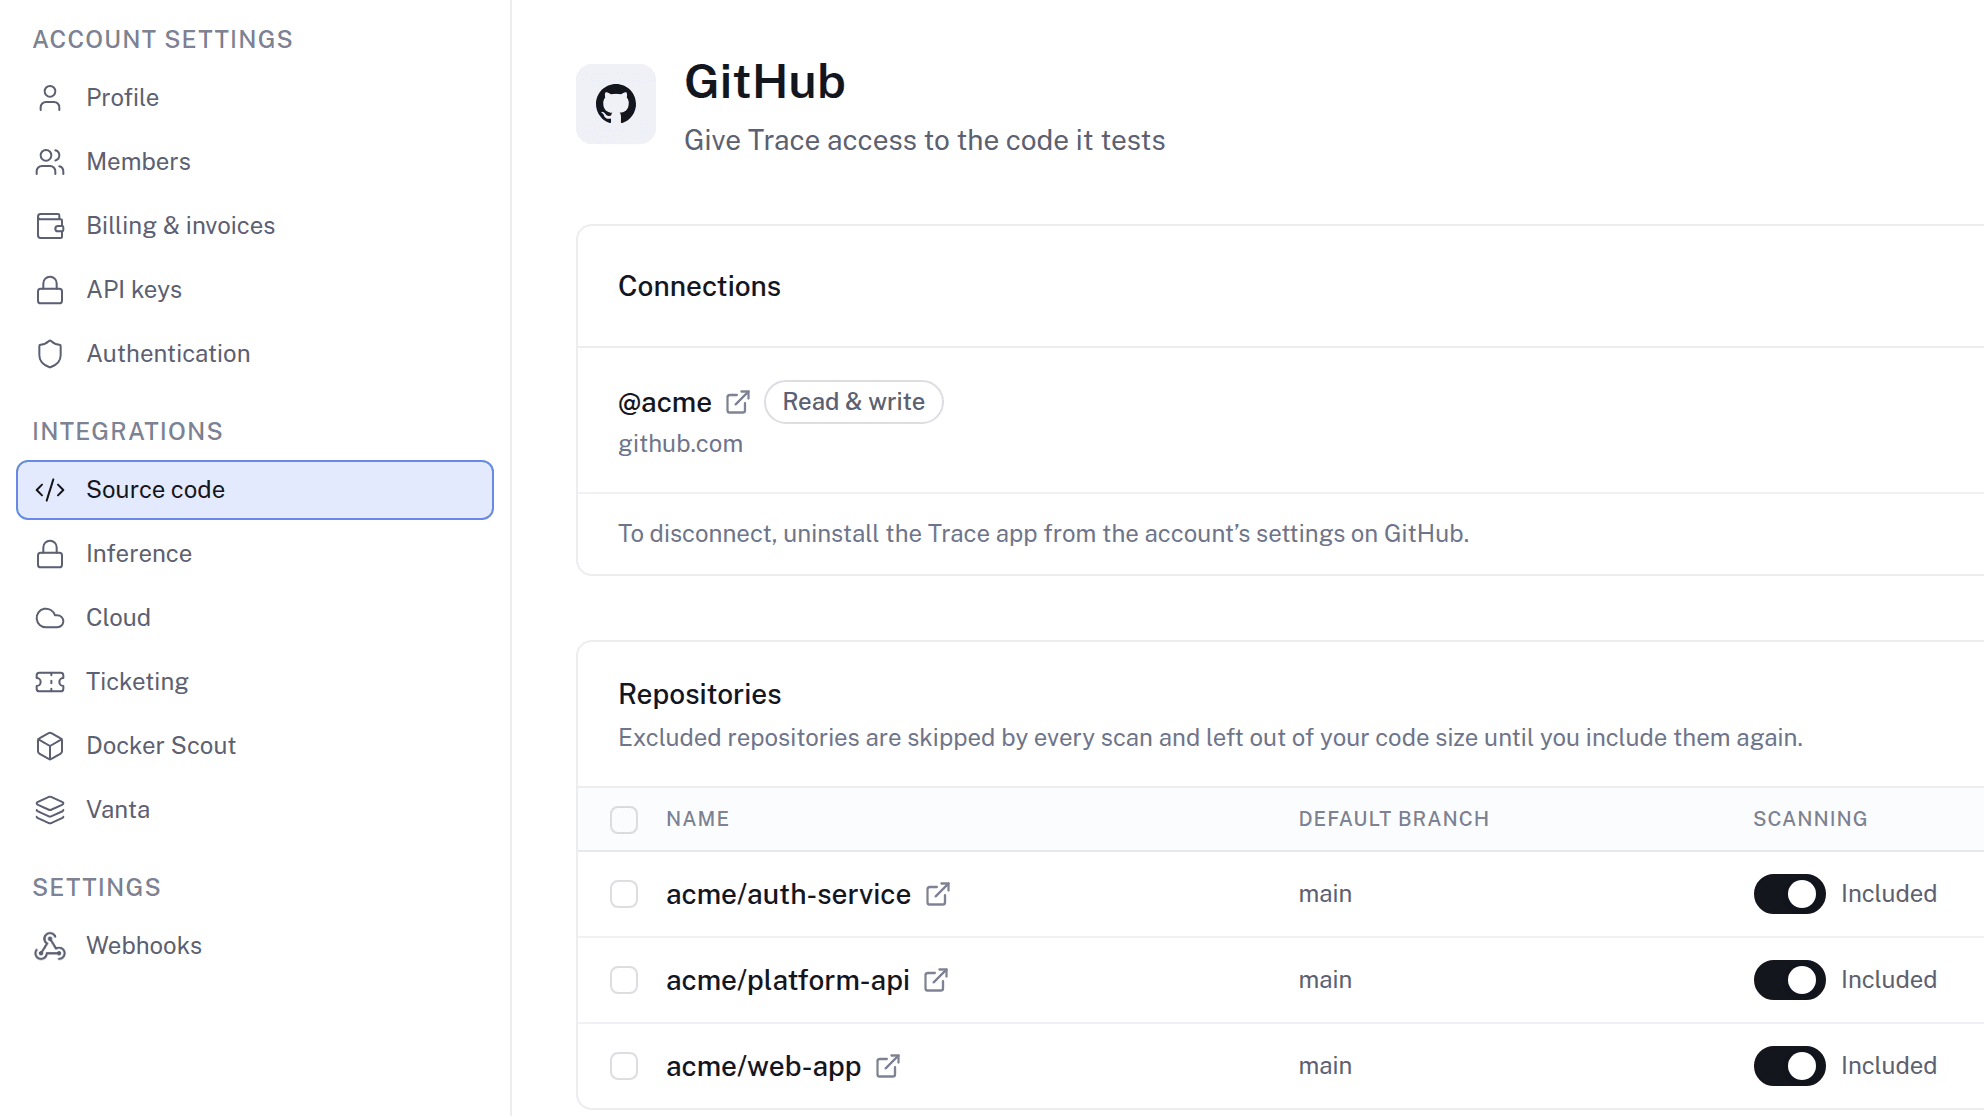
Source, cloud, and ticketing connections give Trace the context a real attacker would map by hand.
Security
How Trace handles your code
Source is cloned into an isolated, ephemeral environment and deleted when the engagement ends. Access is scoped, logged, and yours to revoke.
CLI
Work from the terminal
Authenticate, set up pentest targets, upload source, and pull findings into your own tooling with tracecli.
$ npm install -g securewithtrace
$ tracecli auth login
$ tracecli pentest listResources