Pentest
Pentest overview
How a Trace penetration test works: what it covers, whitebox through blackbox, and findings verified with proof of exploitation.
Trace is an AI-native penetration test. You point Trace at an application, and Trace tests it the way an attacker would. In a whitebox test, it also reads your source code, so it can reason about the code and the running system at the same time. A certified security engineer (OSCP or CISSP) reviews every finding before it reaches you, and every engagement ends with a report and a letter of attestation you can hand to auditors for SOC 2, ISO 27001, and HIPAA, and for PCI DSS on Scale and Enterprise plans.
What Trace tests
A Trace pentest can cover:
- Web applications and APIs: access control, authentication and sessions, injection, SSRF, XSS, business logic, and the rest of the web attack surface.
- Mobile apps: Android and iOS apps, along with the APIs they call.
- Desktop apps and CLIs: the shipped build, how it stores secrets, and how it talks to your backend.
- AI features: LLM-powered chat and agents, MCP servers, and the sandboxes they run in.
- Network and cloud: what's exposed to the internet, and how your cloud setup changes what an attacker can reach. Connect your cloud provider so Trace can see it.
- Cryptography: how your code creates, stores, and checks keys, tokens, and signatures.
Which of these are in your engagement depends on your plan and the applications you set up. See Setting up applications and Pricing.
Whitebox, greybox, or blackbox
Every engagement has a test type, agreed with the Trace team when the engagement is scoped.
- Whitebox (recommended): Trace reads your source code and tests the running application, signed in and signed out. Trace clones the repository into an isolated, temporary environment and reads the auth model, the data flows across files and services, and the business logic, then uses that to find and confirm real attack paths. This is how it reaches the bugs an outside-in test rarely finds: multi-step business-logic flaws, broken object-level authorization, and gaps in tenant isolation.
- Greybox: no source code. Trace tests the running application with test accounts you provide.
- Blackbox: no source code and no accounts. Trace tests the running application the way an outside attacker would, with no inside knowledge.
Whitebox finds the most, because Trace can see why the code does what it does. Greybox and blackbox fit when you can't share source, or when an auditor or customer asks for an outside-in test.
Findings you can trust
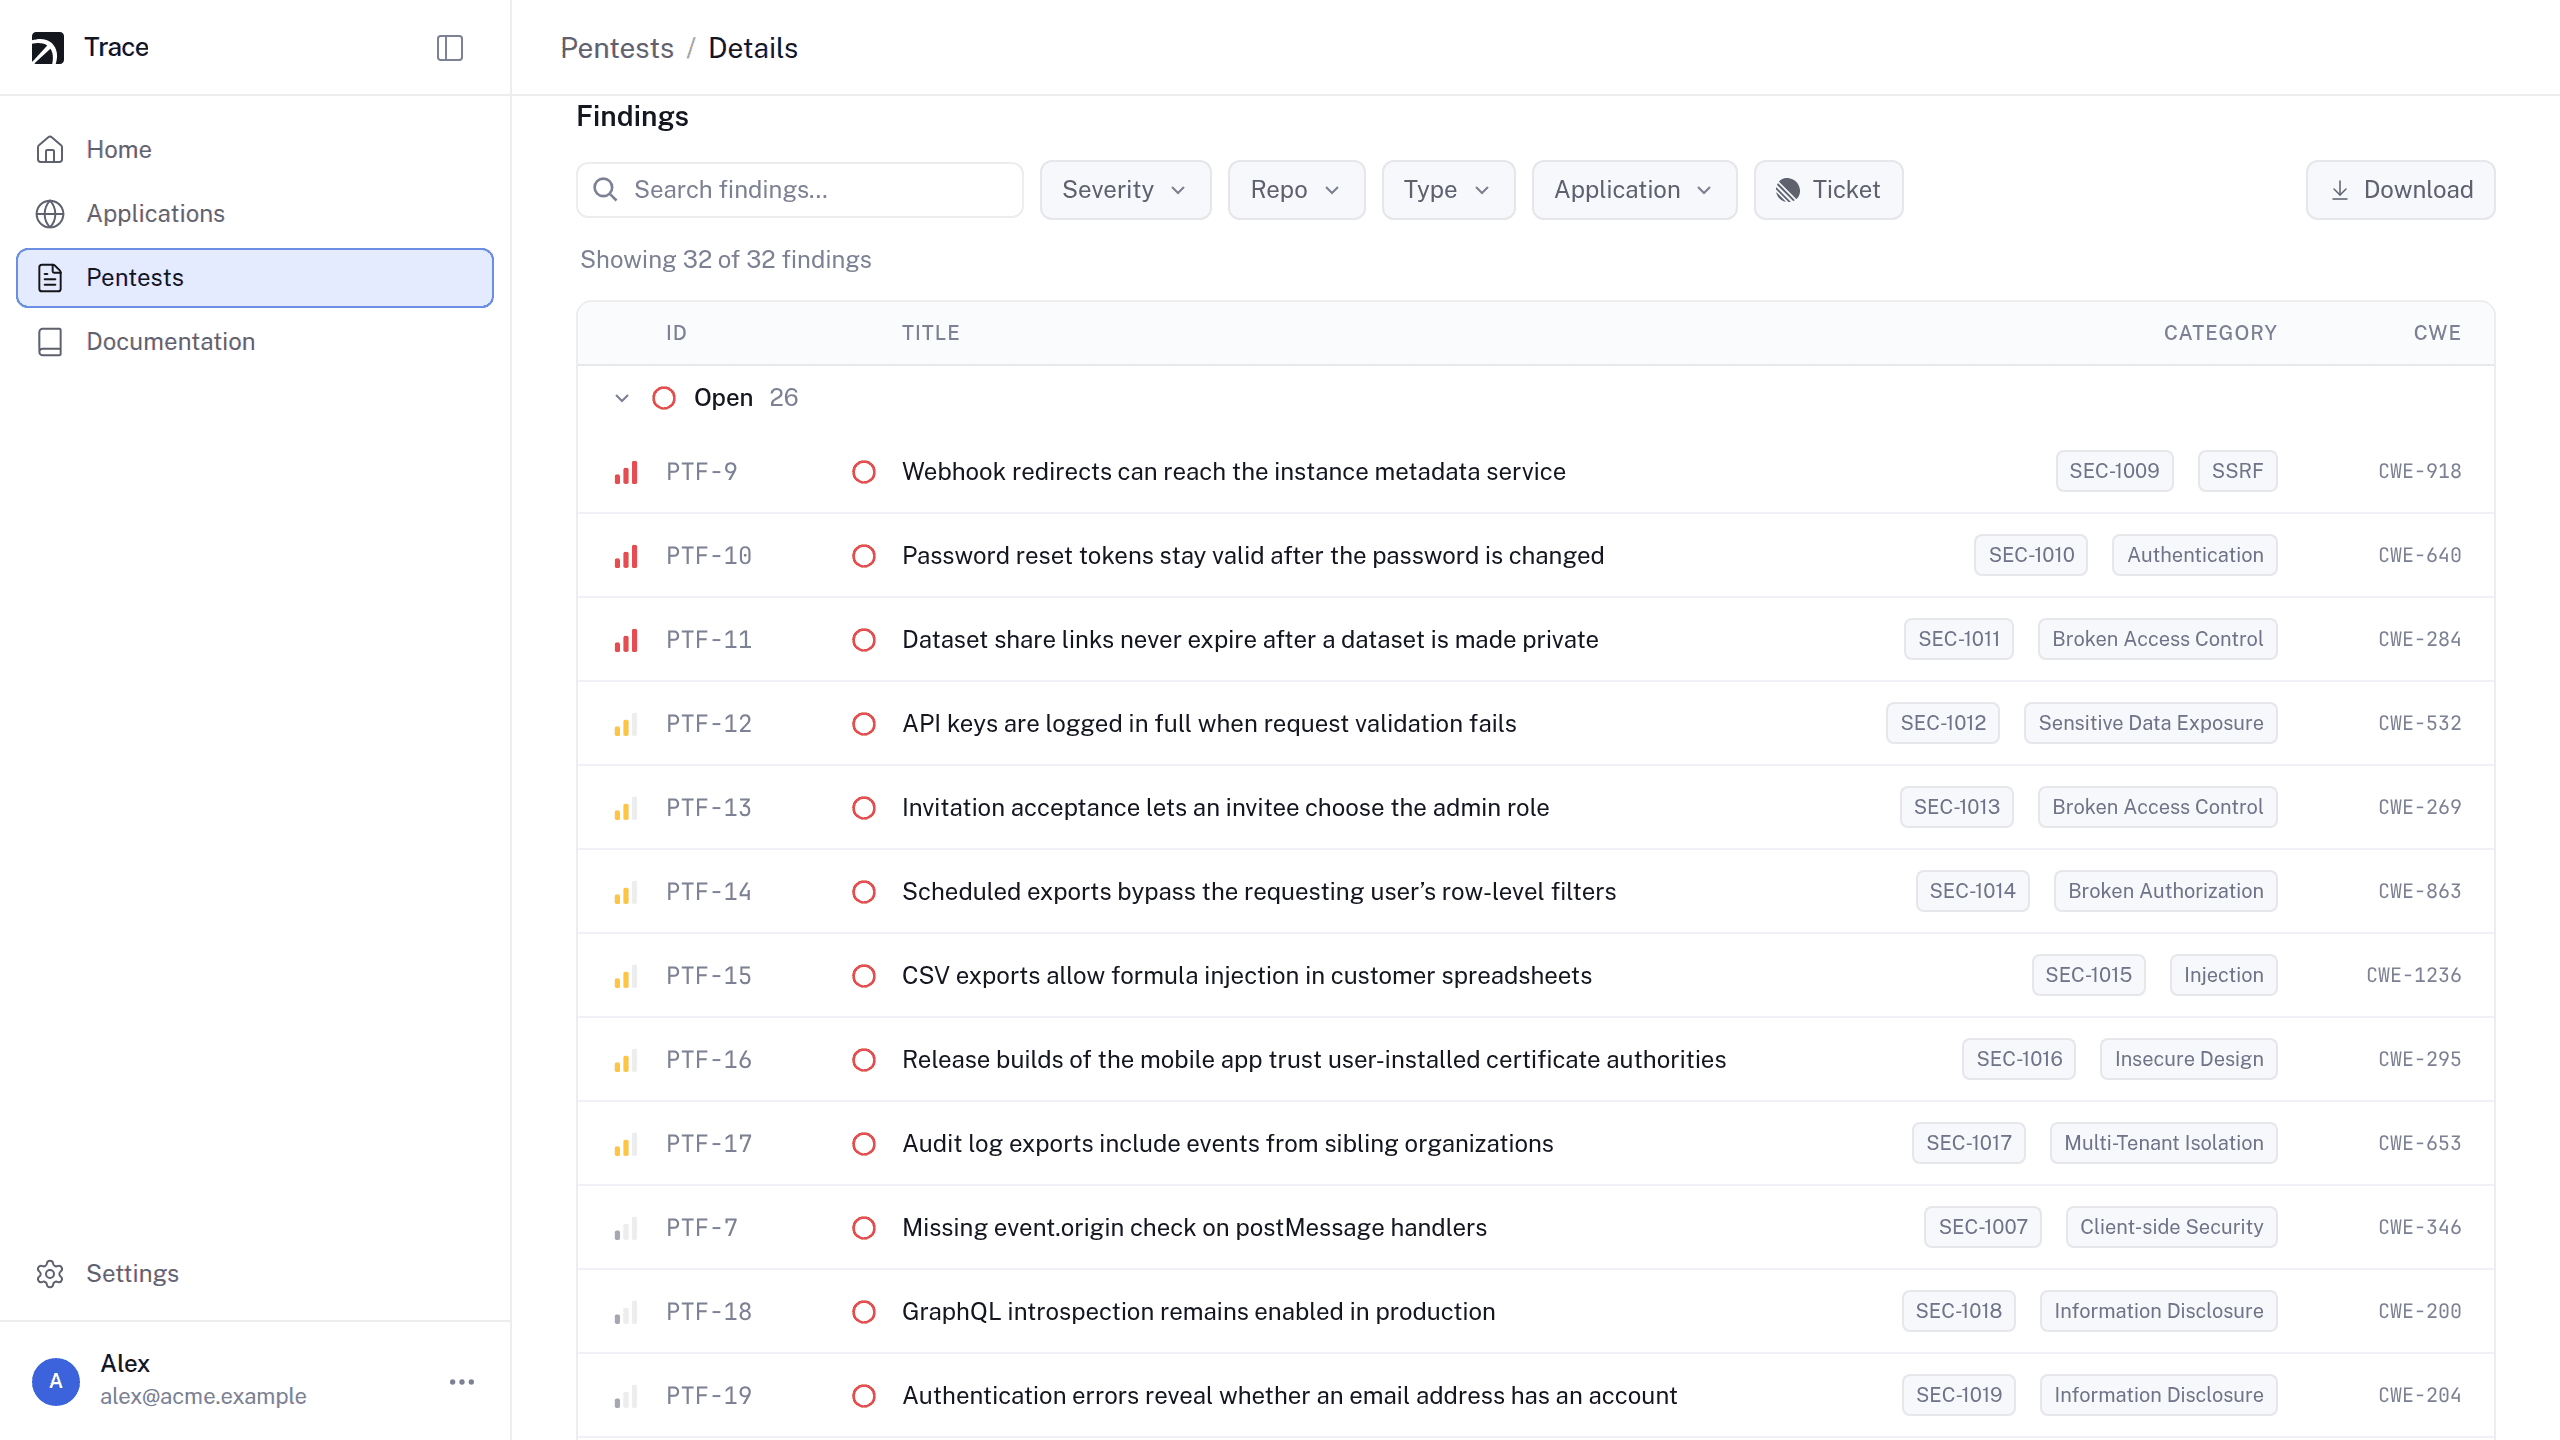
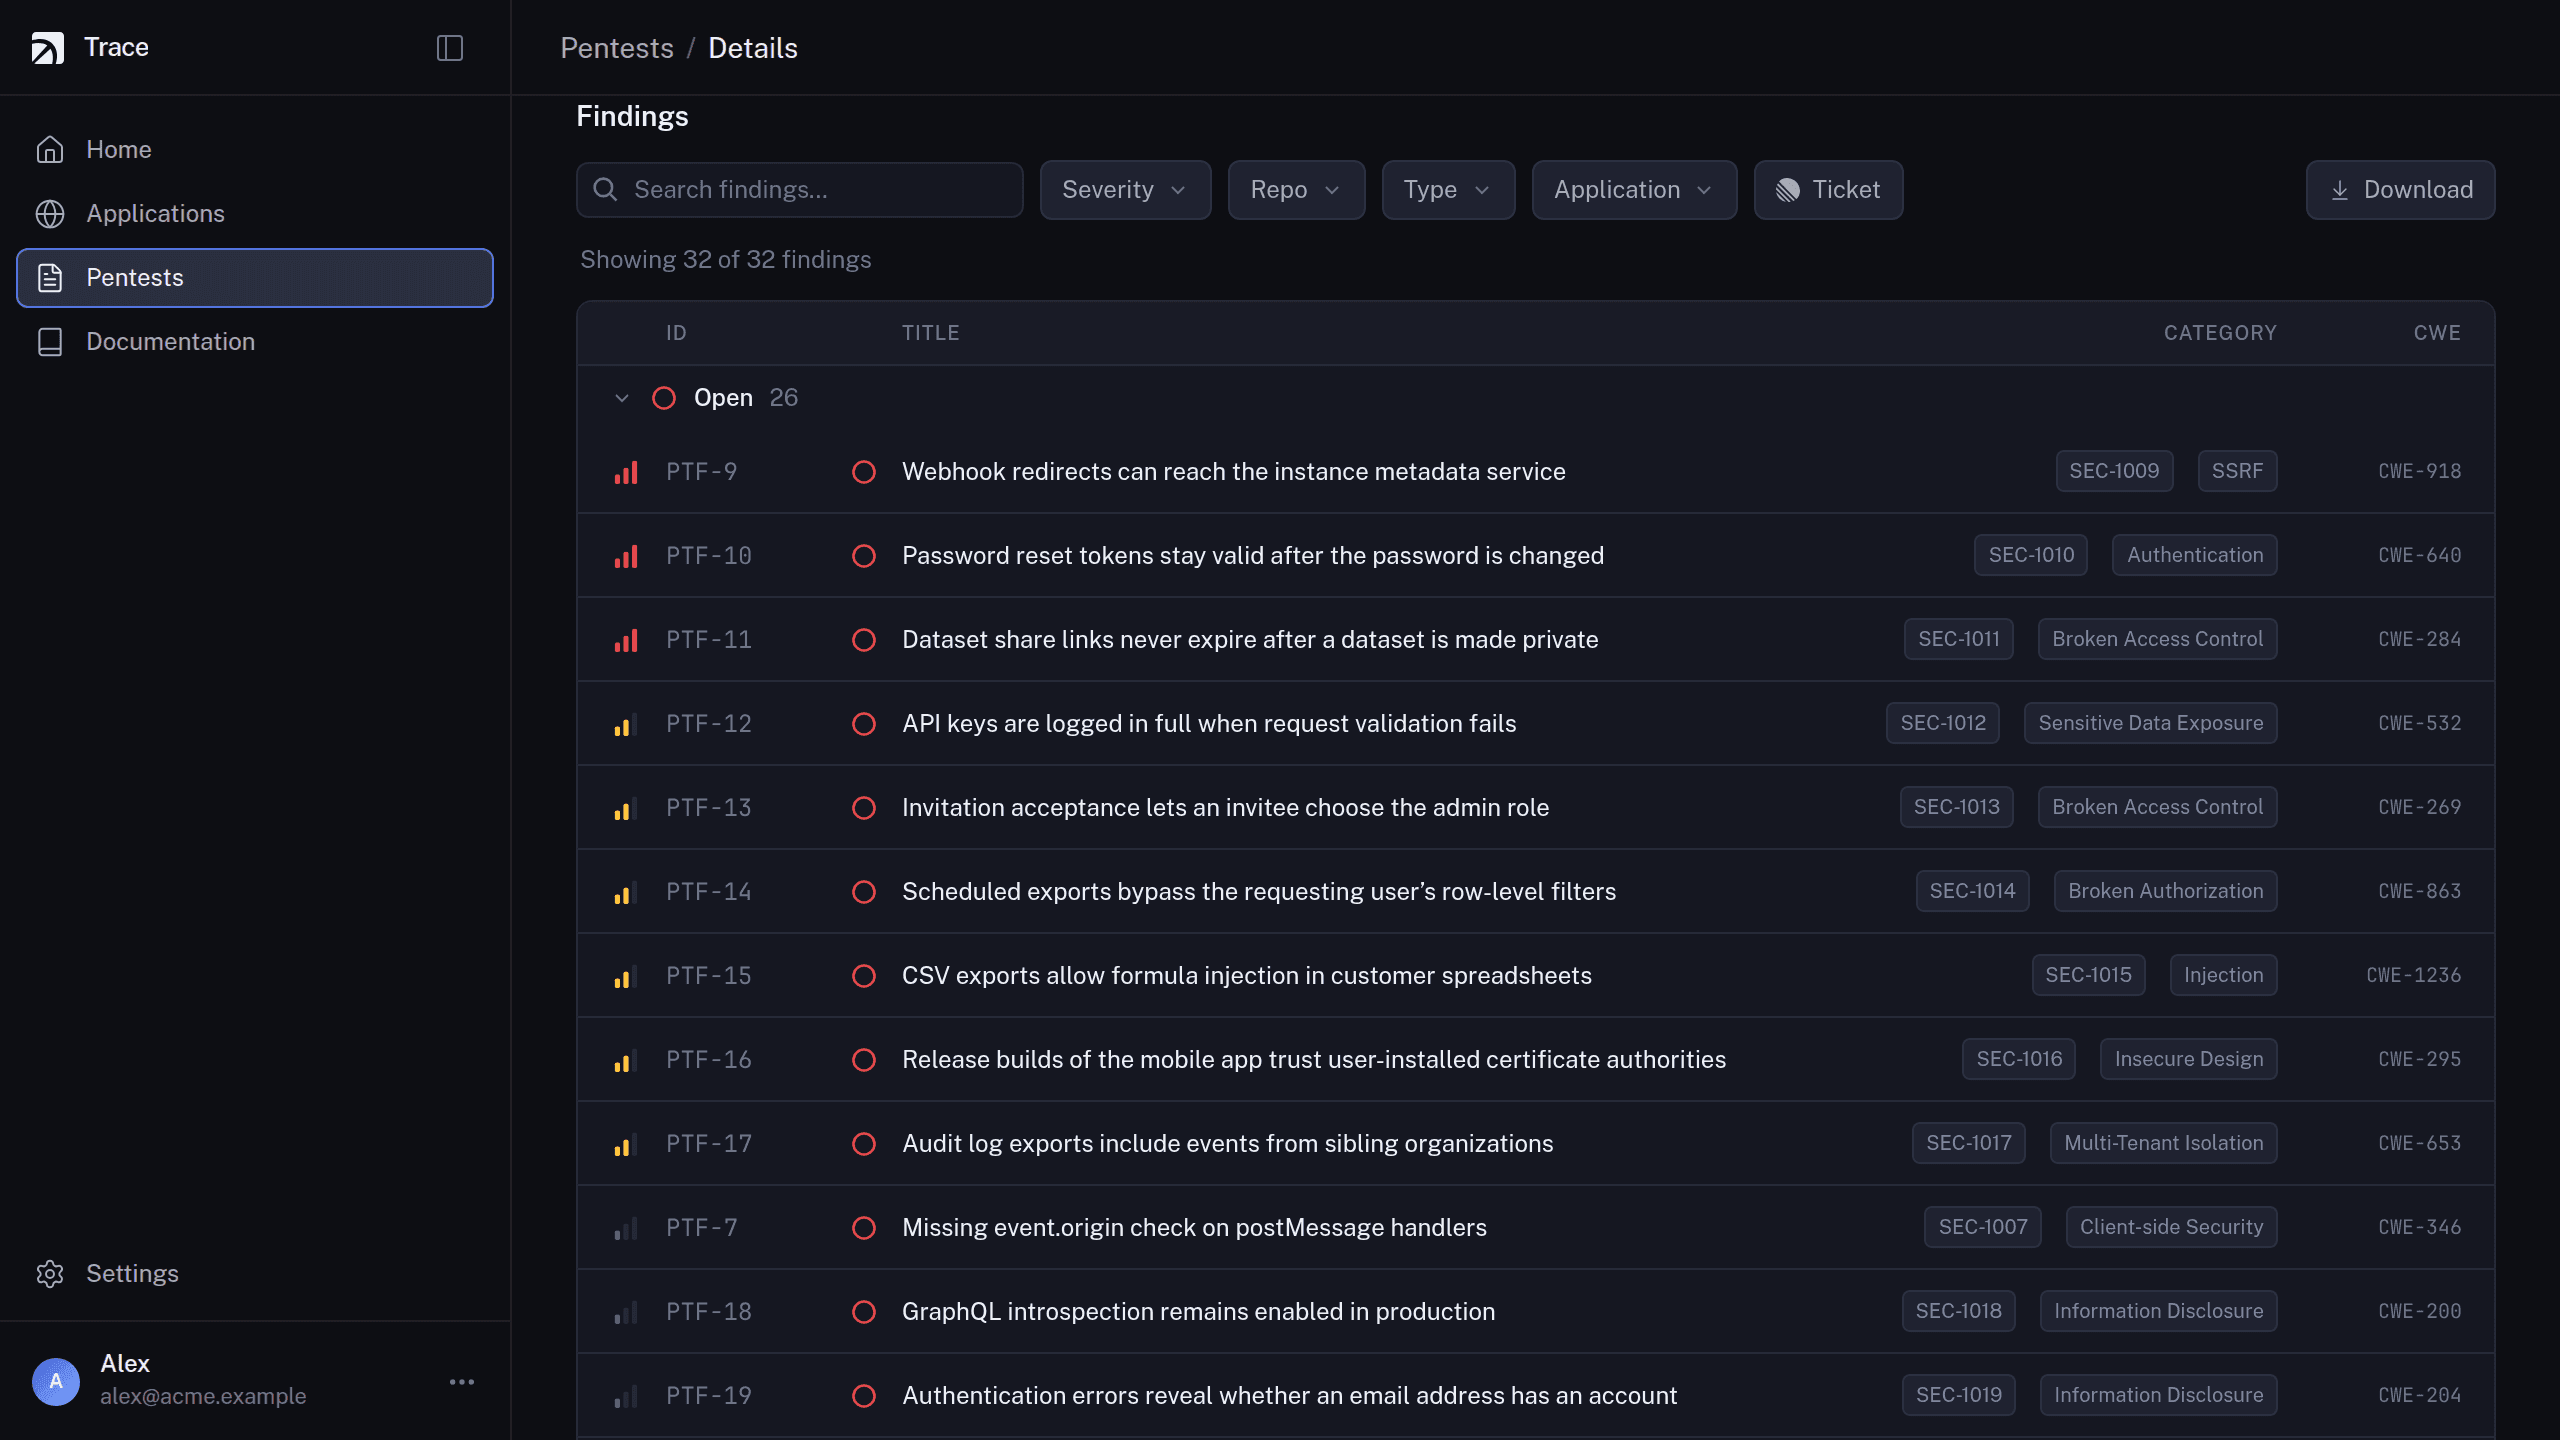
The thing that separates Trace from an automated scanner is what happens after detection. Every candidate finding goes through a verification pass before it reaches your dashboard: Trace articulates the attack vector, the exploit scenario, the prerequisite access, and the impact (with code citations to back it all up), and a security engineer reviews it. Trace doesn't ship a finding it can't substantiate.
The result is fewer findings, but the findings you do see are ones you actually need to fix. Where it's safe and feasible, Trace validates a finding by reproducing the exploit against your live stack, which is what keeps false positives dramatically low. See Verified findings.
What a finding contains
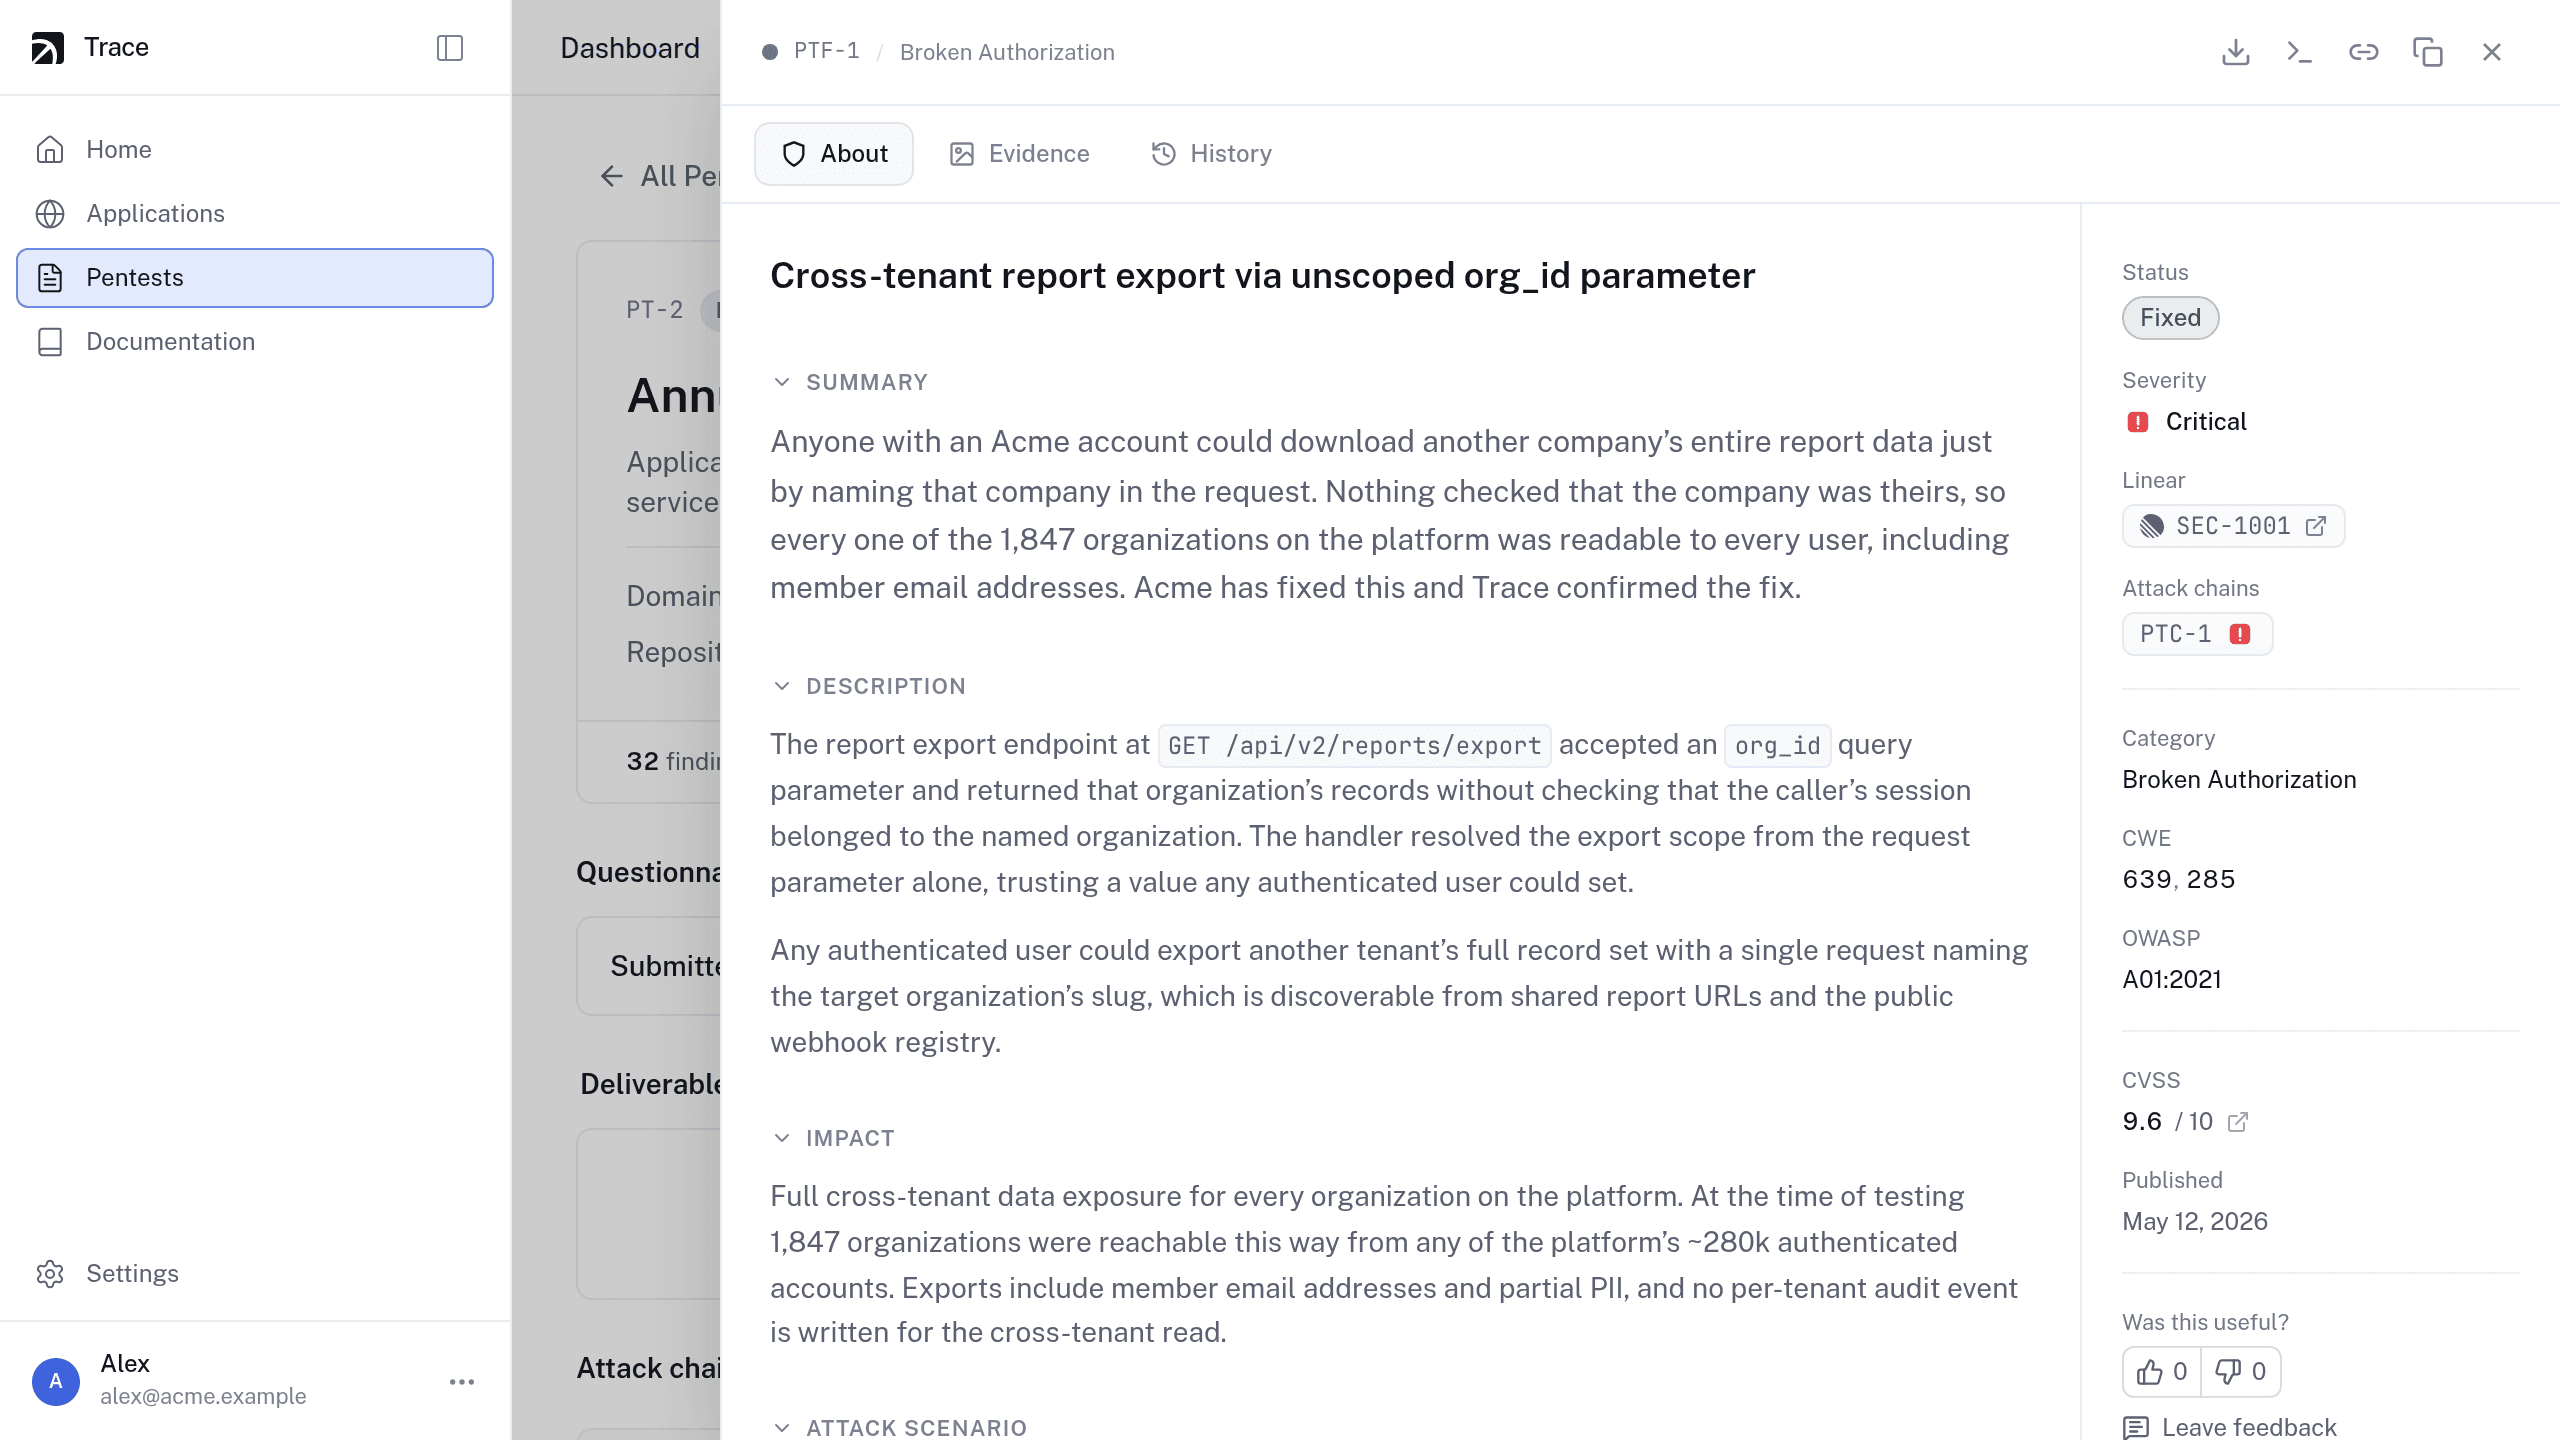
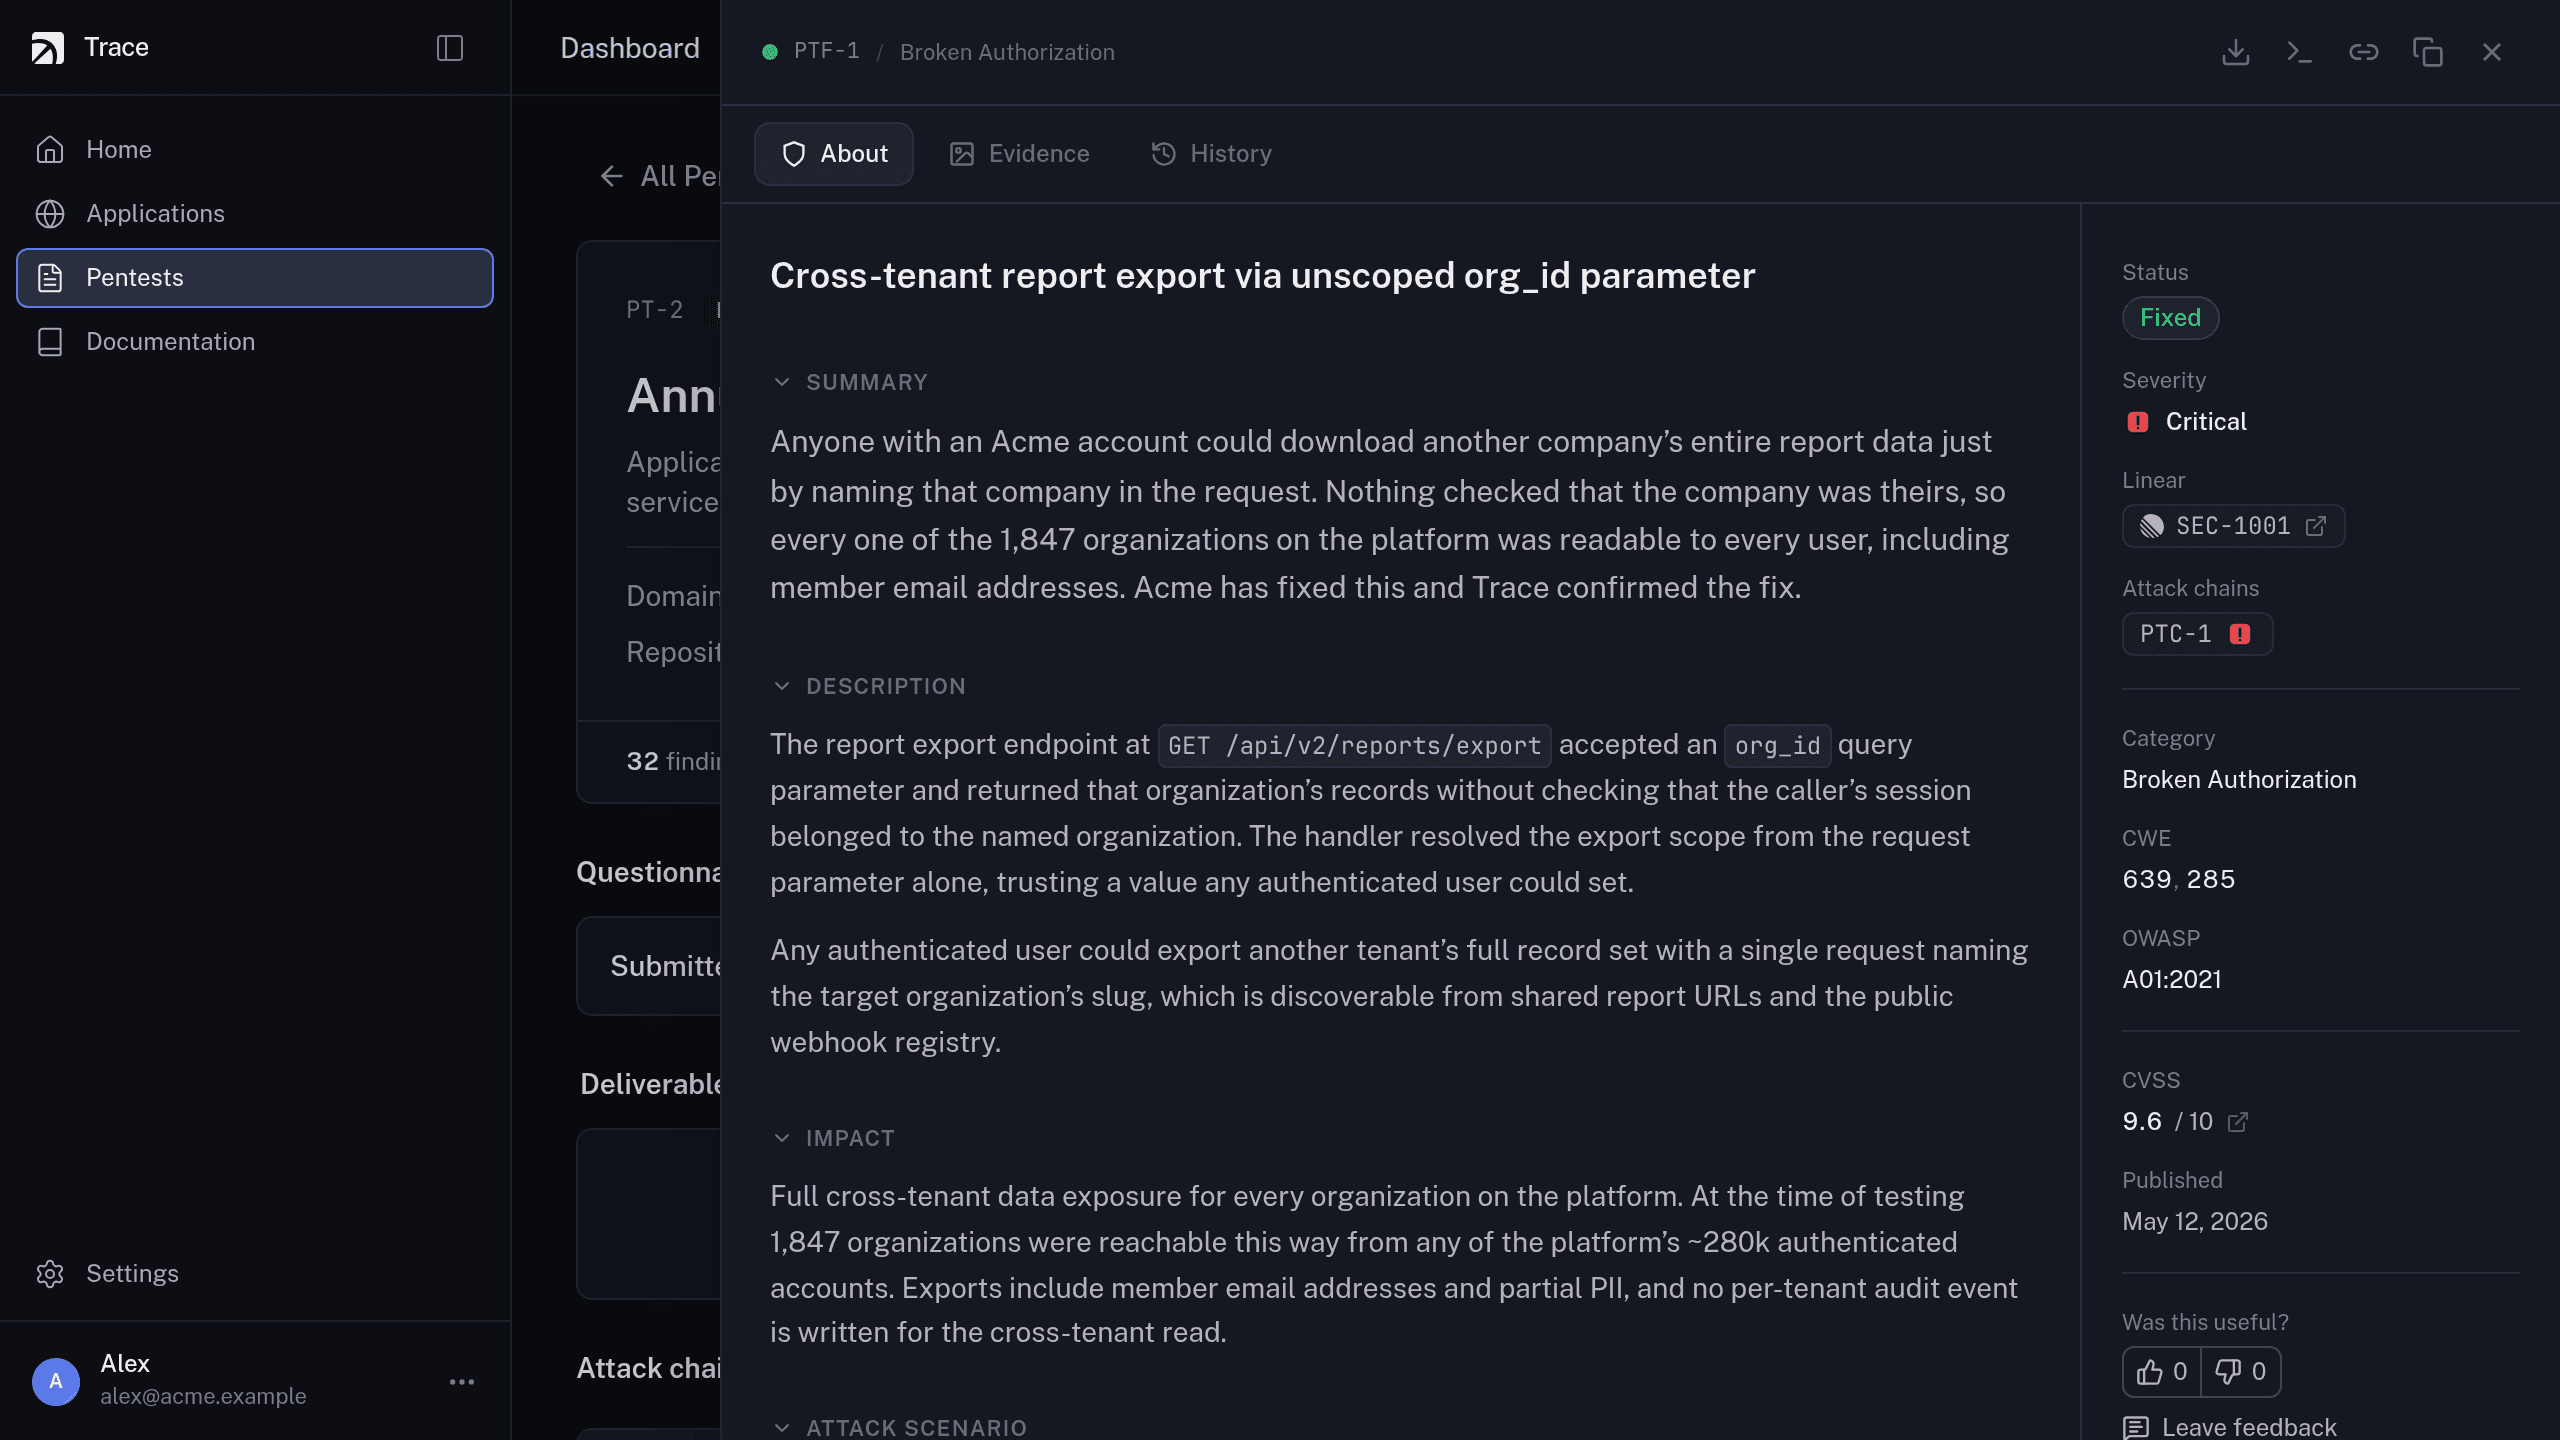
Every finding carries the full context an engineer needs to triage and fix it:
- Severity and CVSS. A tier (
LOW,MEDIUM,HIGH,CRITICAL,INFORMATIONAL) plus a CVSS score and vector, so you can rank work and feed risk-tracking systems. - Category, CWE, and OWASP. The vulnerability class and its CWE and OWASP Top 10 classifications.
- Root cause and impact. Where in the code the weakness lives, with the affected repository, file, and line range, and what an attacker gains from it.
- Attack scenario and proof of concept. The steps an attacker takes, and the requests, responses, and captured evidence Trace used to prove them.
- Remediation and verification. What to change, and what Trace observed when it re-tested the fix.
Fixing findings
Mark a finding remediated once your fix is deployed, and Trace retests it to confirm the fix holds. You can retest as many times as you need, and you can accept or dispute a finding you disagree with. See How an engagement works.
Where findings show up
- The dashboard. A live view of every finding by pentest, severity, and status. The pentest report and the letter of attestation are under Deliverables once Trace issues them. When an engagement covers several applications, Trace can also give you a report on one or more of them: each gets its own row under Deliverables with its own download, and
tracecli pentest report download --reportfetches it by application name. - The Trace CLI. List pentests and query findings from your terminal. See the
pentestcommands. - Notifications. Slack and email, so the right people hear about critical findings as they land.
On-demand by design
Pentests are manual: Trace never starts an engagement on its own. A pentest runs only when the Trace team starts one, on the scope and schedule you agree. That keeps testing intentional: you agree which applications, which environments, and when.