Platform Overview
How Trace scans your code, what gets verified, and where findings show up.
Trace continuously scans your GitHub repositories for vulnerabilities, exposed secrets, and risky dependencies — and delivers the findings to the places your team already works: pull requests, GitHub's Security tab, the Trace dashboard, and your notification channels.
The three engines
Every connected repository is scanned by three independent engines, running in parallel.
| Engine | What it finds |
|---|---|
| Static Analysis (SAST) | Code-level vulnerabilities — injection, auth bypasses, business-logic flaws, AI/LLM application risks like prompt injection and unsafe agent tool use, and the subtle bugs that only become visible when the engine understands what your code is trying to do. No rule files to maintain. |
| Software Composition Analysis (SCA) | Known CVEs in your dependencies, prioritized by whether the vulnerable code path is actually reachable from your application. A lodash CVE that's only triggered by a function you don't use isn't a vulnerability — it's noise. |
| Secrets Detection | Hardcoded credentials in your code and git history. Where possible, Trace verifies live secrets against the provider's auth endpoint, so you know which exposures need to be rotated now. |
Findings you can trust
The thing that separates Trace from a rule-based scanner is what happens after detection: every candidate finding goes through a verification pass before it ever reaches your dashboard. Trace doesn't ship a finding until it can articulate the attack vector, the exploit scenario, the prerequisite access, and the impact — with code citations to back it all up.
The result is fewer findings, but the findings you do see are ones you actually need to fix.
A preview of where this is going: for supported vulnerability classes, Trace will soon run the exploit against a sandbox or staging environment and capture a recorded proof of exploitation. See Verified Vulnerabilities.
Marking false positives
Verification is good, but it isn't perfect — and what counts as a "real" issue depends on your codebase. If a finding is wrong for your context, mark it as a false positive from the dashboard or directly from the PR review comment. Trace records the marking along with the code context that produced it (file, function, vulnerability class, surrounding pattern) and generates a smart suppression rule.
From the next scan onward, the engine recognizes the same pattern and won't re-surface it — without anyone having to maintain a static ignore file. If your codebase changes in a way that breaks the suppression's assumptions, the engine reopens the conversation.
Every suppression rule is visible and editable from the dashboard. You can review exactly what's been suppressed and why, edit the scope, or revoke a rule at any time — nothing the engine learns is hidden from you.
Where findings show up
Findings reach you through multiple channels at once:
- PR check runs. A
Trace Security Scancheck appears on every pull request with a status and a link to the full results. - Inline review comments. Findings against changed lines post as PR review comments — so developers see issues in the diff they're already looking at. See Pull Request Workflow.
- GitHub Code Scanning (SARIF). Findings appear in the Security tab and feed into branch protection rules.
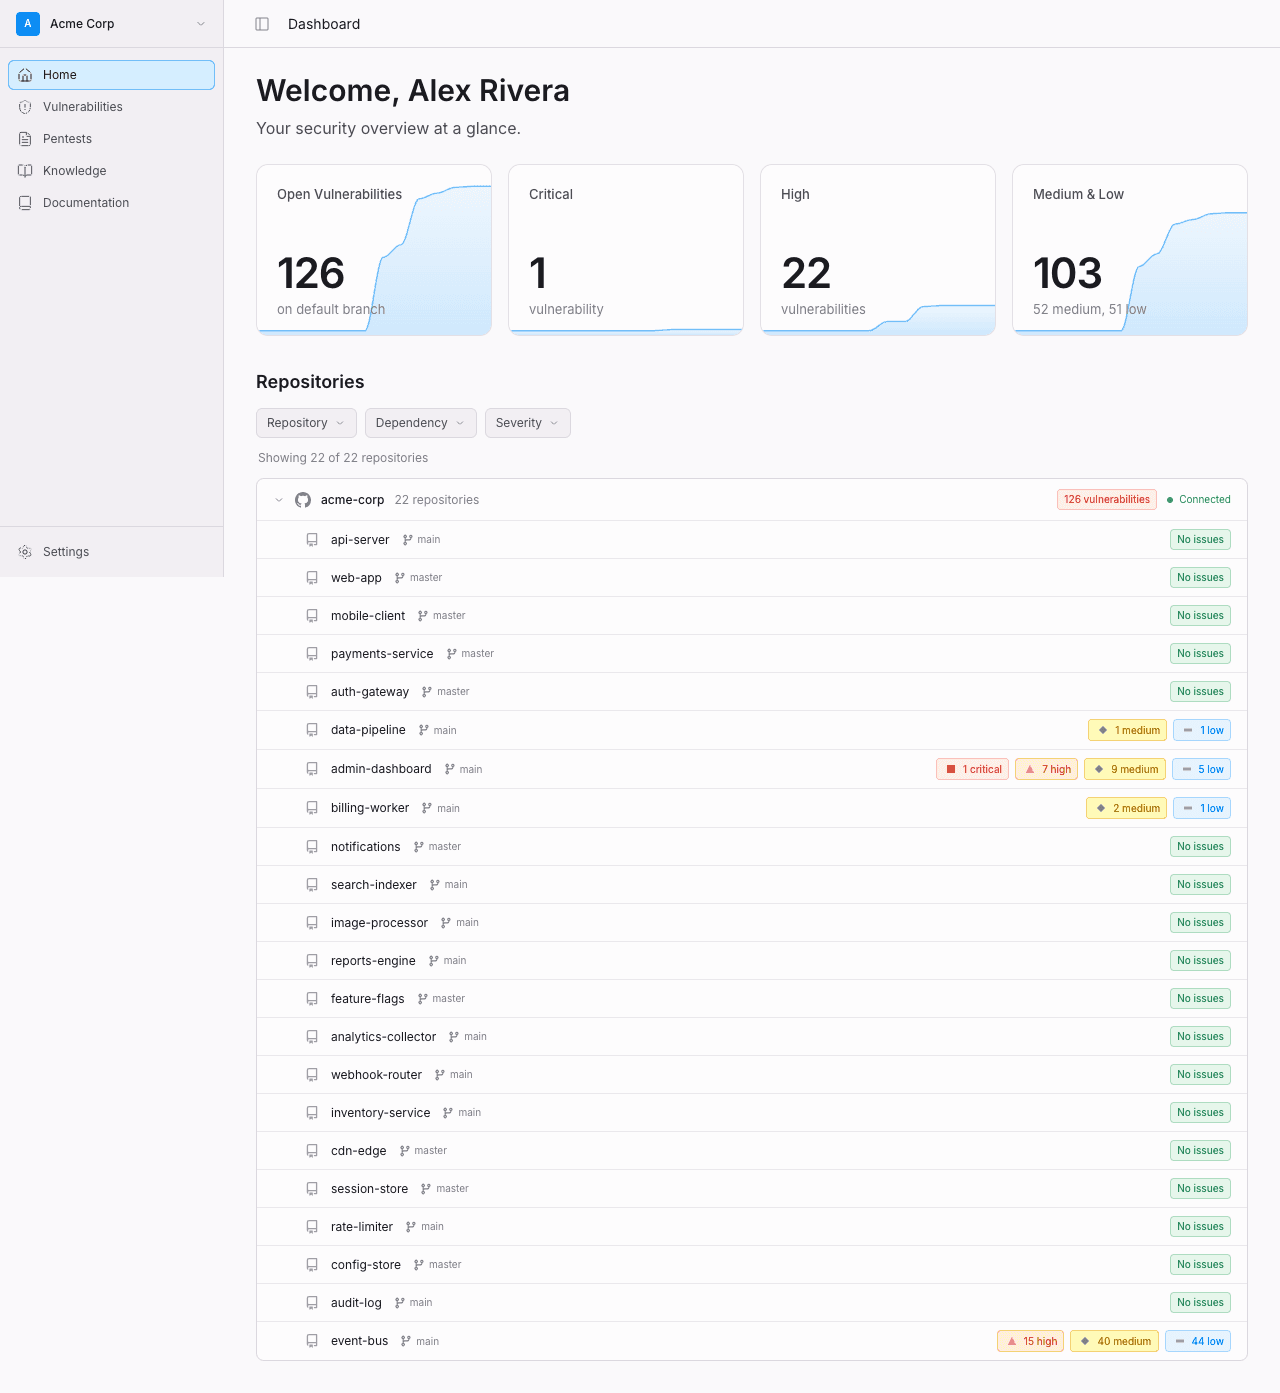
- The dashboard. A live view of every open vulnerability, by repo, by severity, and by status. Every state change is tracked with actor, action, and timestamp for audit.
- Notifications. Slack, email, and webhooks (with Linear and Jira coming soon). Subscribe per organization or per channel.
- The Trace CLI. Query findings and pull data into your own tooling.
Every finding carries severity (LOW, MEDIUM, HIGH, CRITICAL) and a CVSS score. The severity tier is what drives PR check decisions and notifications by default; the CVSS score is what you'll use to integrate with risk-tracking systems.
When scans run
| Trigger | When it runs |
|---|---|
| Pull requests | Every PR open and update. Posts a check run, inline review comments, and uploads SARIF. |
| Push to default branch | An incremental scan against the new commit range. |
| Daily | A scheduled scan of the default branch — catches CVEs disclosed after your code was already shipped and verifies live-secret status. See Continuous Monitoring. |
| On demand | Trigger a manual scan or retest a specific vulnerability from the dashboard. |
Scans on the same branch are coalesced: if a scan is already running when a new event arrives, Trace waits for the in-flight scan to complete rather than running a duplicate.
What's next
- Static Analysis (SAST) — How the engine reads your code, including AI-specific risks.
- Software Composition Analysis (SCA) — Dependency scanning with reachability.
- Secrets Detection — Live-secret verification.
- Pull Request Workflow — Check runs, inline comments, blocking policy.
- Continuous Monitoring — Daily scans and drift detection.
- Verified Vulnerabilities — Coming soon: proof of exploitation in a live environment.